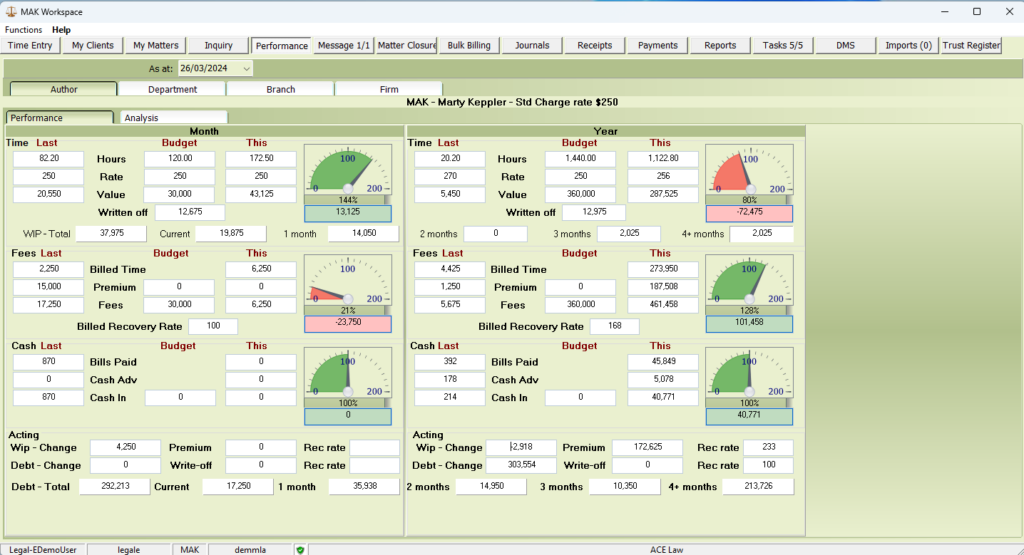
The Performance tab provides key performance indicators (KPIs) for individual authors, departments, branches, or the entire firm.
The displayed data corresponds to the selected month and financial year.
Access to this tab is controlled by user-specific security settings. For example, a solicitor might only view their own performance metrics, while a partner could access performance statistics for the entire firm.
Performance Tab

Each field can be drilled down on to review detailed information about the displayed balances. By right-clicking, you can also generate a Management Report with your personal performance details.
Information displayed includes:
- Chargeable Hours: Monthly and yearly totals with corresponding dollar values.
- Chargeable Budget Hours: Monthly and yearly targets with corresponding dollar values.
- Time Budgets vs. Actuals: Graphical and numerical comparisons of time budgets and actuals.
- Written-Off Time: Monthly and yearly values of written-off time.
- Aged WIP Analysis: Detailed analysis of aged work in progress.
- Billed Time: Monthly and yearly dollar values for billed time.
- Premiums (Markup/Markdown): Monthly and yearly dollar values for premiums.
- Apportioned Fees: Monthly and yearly dollar values for apportioned fees.
- Fee Budgets vs. Actuals: Graphical and numerical comparisons of fee budgets and actuals.
- Billed Time Recovery Rates: Monthly and yearly recovery rates for billed time.
- Cash Received: Monthly and yearly totals, including fee and disbursement apportionments.
- Cash Budgets vs. Actuals: Graphical and numerical comparisons of cash budgets and actuals.
- Debtor Write-Offs: Monthly and yearly values of written-off debtor amounts.
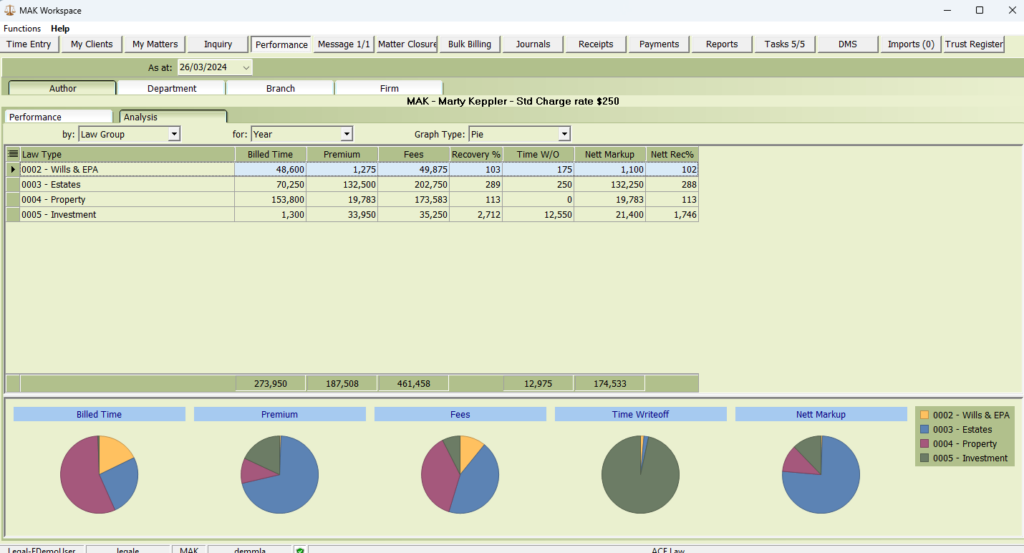
Analysis Tab

Information displayed includes an analysis of fees grouped by Law Group Type, Matter Acting Author, or Client Introducing Partner.
The view can be adjusted to report on:
- The current month
- The current financial year
- The previous month
- The previous financial year
You can also customise the type of graph displayed for a different visualisation.
The analysis includes values for:
- Billed Time
- Premiums
- Fees
- Recovery Percentage of Fees compared to Billed Time
- Time Written Off
- Net Markup being Premium less Time written off
- Net Recovery Percentage of Fees being Fees compared to Billed time less Time written off